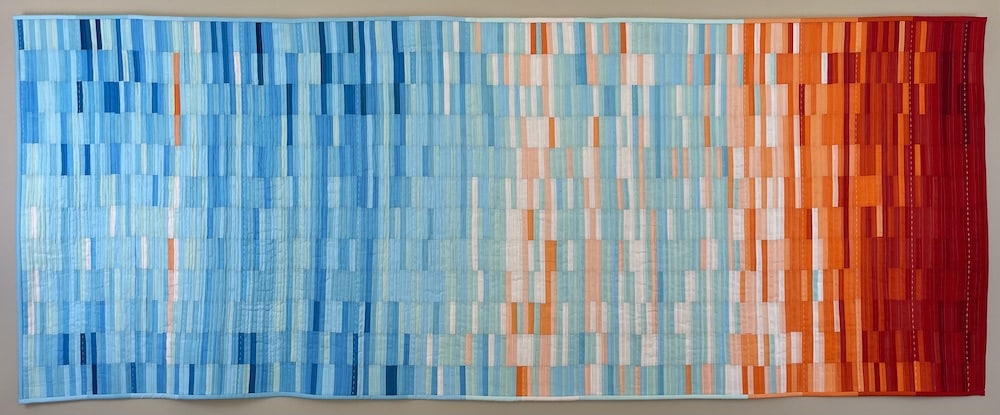
You’re Getting Warmer: Rising Global Temperatures 1850-2022
Made by Lorraine Woodruff-Long 32”x92” 2023 Cotton top, batting, back. Machine pieced, machine & hand quilted
This quilt illustrates the global change in temperature for every year and month between 1850 (left) to 2022 (right). Each vertical line is a year reflecting temperature data for the 12 months of that year, January (top) to December (bottom). Blue represents cooler years/months and red, warmer years/months. Darker colors indicate more extreme temperatures in both directions. The color of each strip represents the temperature change of that year/month relative to the 1961-1990 mean (i.e. the average of the data during 1961-1990 is zero). Each block (2064 months) measures ½” x 3”.
The overall effect reflects a striking trend toward hotter temperatures in recent decades as a result of human-caused climate change. (Data Source: Professor Ed Hawkins MBE, National Centre for Atmospheric Science, University of Reading, UK www.showyourstripes.info)
What are these graphics? These ‘warming stripe’ graphics are visual representations of the change in temperature as measured globally in the past 172 years. These visuals are not meant to tell the entire scientific story of climate change, but are merely intended to get the conversation started in an efficient way that requires minimal scientific knowledge.
Warming stripes was created with the intention of making visualizing climate change easier for non-scientists.Warming stripes achieves this goal by using simple, vibrant, intuitive colors with universally understood meanings. Blue represents cold temperatures and red represents warm temperatures. Darker shades indicate more extreme temperatures in both directions. The graphics use color alone to convey temperature trends, leaving out specific details, numbers, labels and wording that may be confusing to people who are not climate scientists.
Why are there no numbers on the graphics? These graphics are specifically designed to be as simple as possible, and to start conversations about our warming world and the risks of climate change. There are numerous other sources of information which provide more specific details about how temperatures have changed, so these graphics fill a gap and enable communication with minimal scientific knowledge required to understand their meaning.
How have these graphics been made? The data comes from the Berkeley Earth temperature dataset, updated to the end of 2022.

